Trading tools that account for fees
Calculate net P&L, break-even and position size, then review your trades with the TrueLedger journal.
- No sign-up
- Your prices, your fees
- Published, tested formulas
- EN · FR
The range
From plan to payout: 4 tools, one system
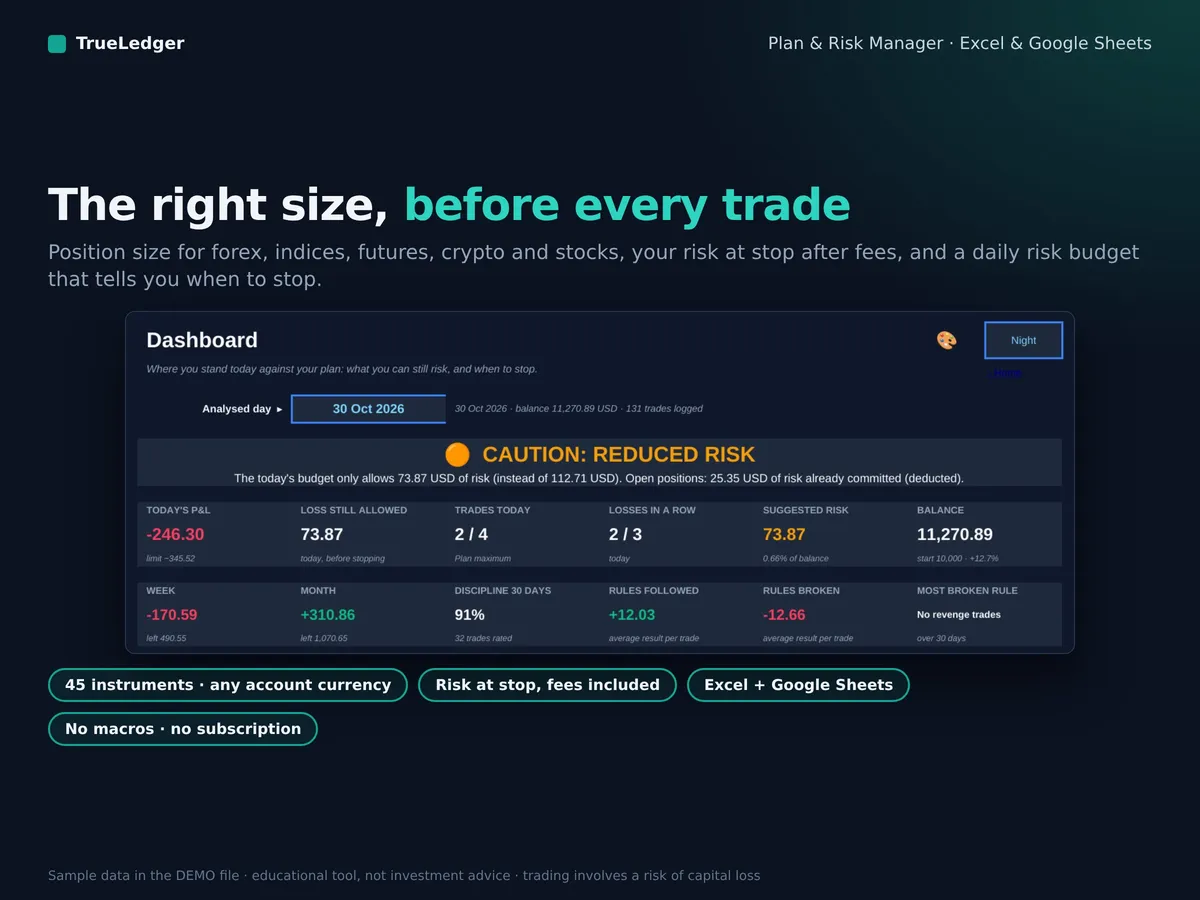 1. Before the trade
Plan & Risk ManagerThe right size and your risk budget, before every trade€15
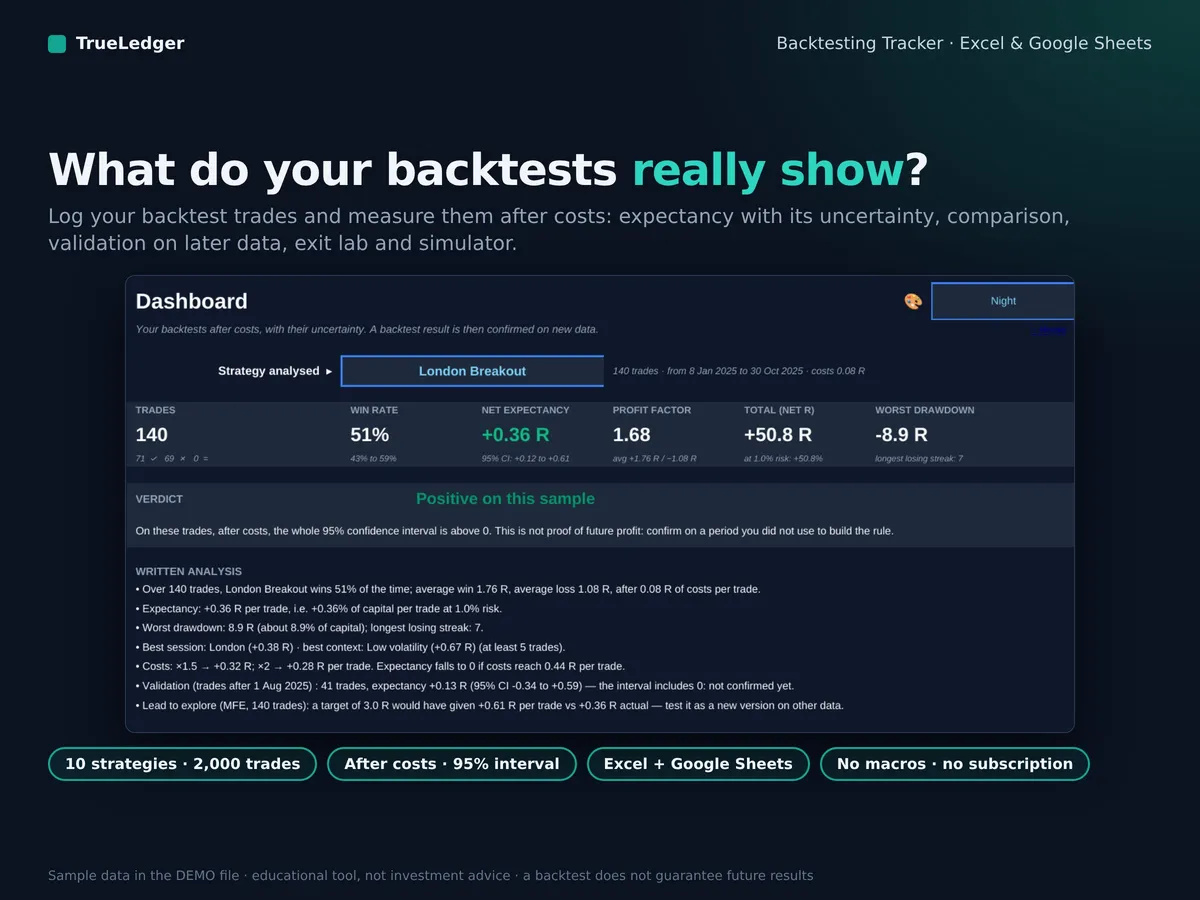 2. Test
Backtesting TrackerDoes your strategy have a real edge? Measure it€19
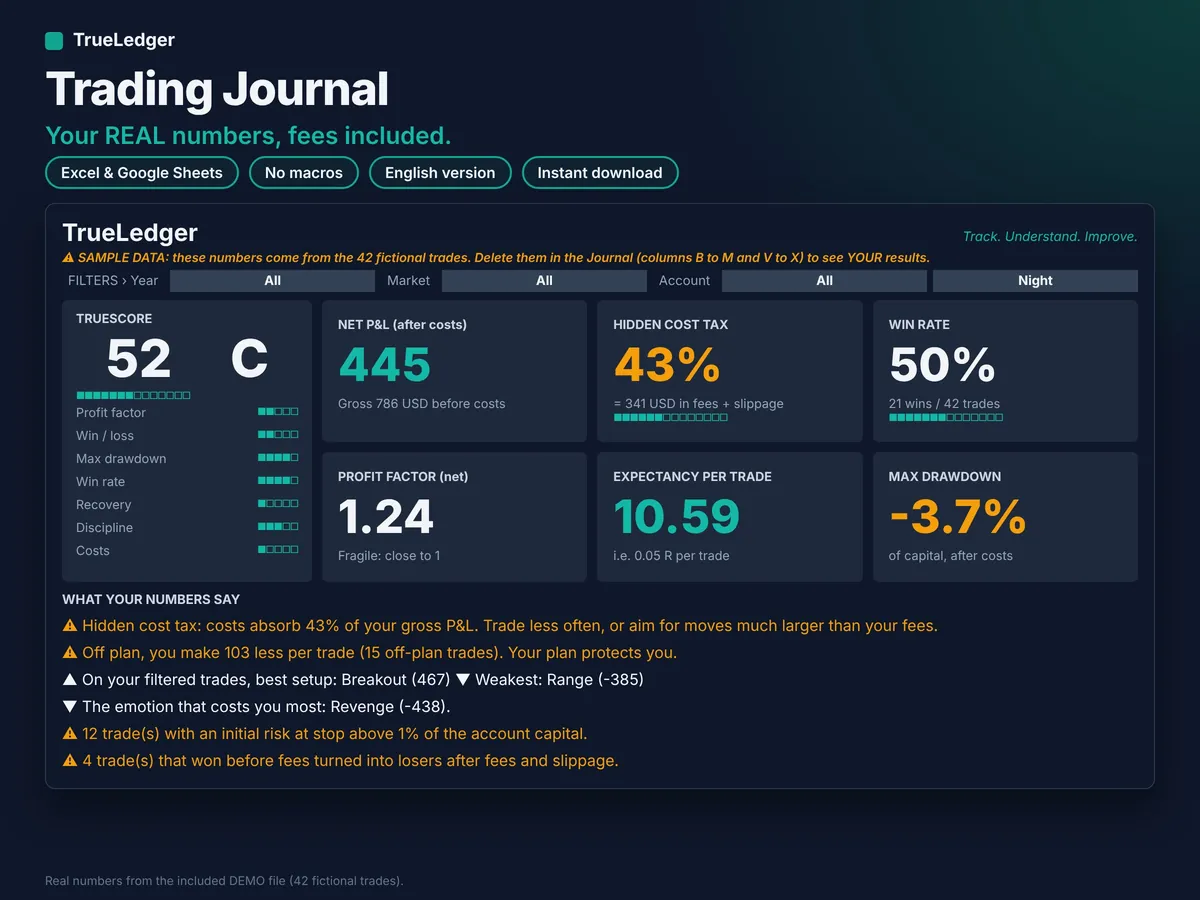 3. Trade
Trading JournalYour real results, fees included€29
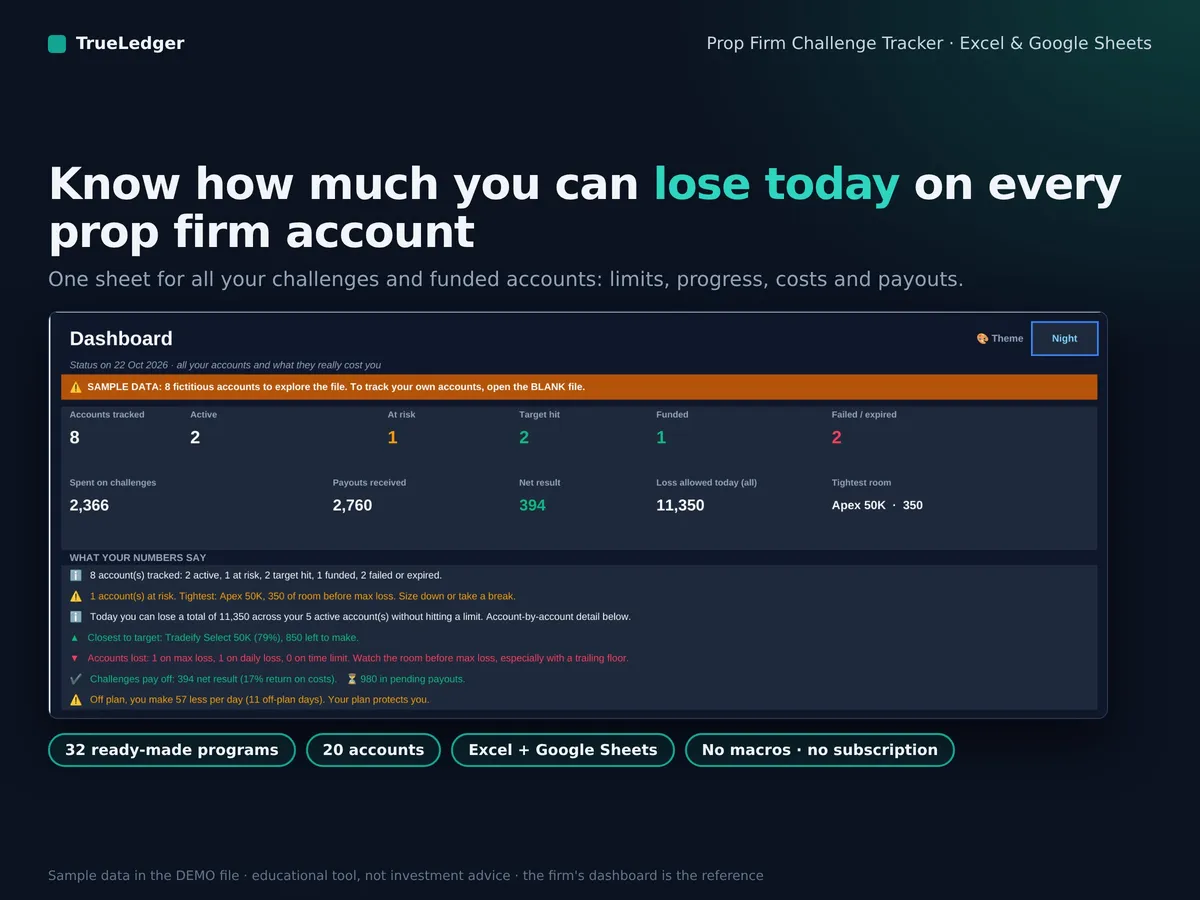 4. Get funded
Prop Firm Challenge TrackerThe loss allowed today on every prop firm account€19
All 4 tools in the complete bundle — €59 €82 when bought separately
English and French, DEMO files, no subscription.
Two free calculators
Trading P&L & Break-Even Calculator After Fees
- Gross P&L → fees → net P&L
- Exact break-even price
- Stocks, forex, futures, crypto
Position Size Calculator with Commission & Spread
- Loss at the stop, fees included
- Size rounded down
- Shares, forex lots, contracts, crypto
The journal
Apply this calculation to every trade
The TrueLedger journal (Excel and Google Sheets) applies the same logic to your whole history: net P&L after fees, discipline, cost of mistakes, weekly review. No subscription, no account connection required.
Why fees change the result
A trade targeting $300 gross can bring only $229.70 once commissions and slippage are deducted: 23% of the gain goes to costs. For a strategy that targets small moves, that share can decide whether it is profitable at all.
One system, from plan to review
- Plan the trade
Entry, stop, target: the trade scenario. - Size the position
The size that respects your risk, fees included.
→ Open the calculator - Calculate net P&L
Result after commissions, spread and slippage, plus break-even.
→ Open the calculator - Record it in TrueLedger
One row in the journal, or a MetaTrader import.
→ Discover the journal - Review performance
Dashboard, discipline, cost of mistakes, weekly review.
→ Discover the journal
Guides
Transparency. Every formula is published, with its assumptions, limits and examples you can redo by hand. They are checked by more than 1,600 automated tests before every update. See the methodology →